
Firewall Sessions. Palo Alto Troubleshooting.
- 10 sept 2018
- 6 min de lectura
Let´s continue talking about firewall sessions.
Once we understand what is it and some basic knowledge of them (explained in FIREWALL SESSION.INTRO post), we can start troubleshooting.
First of all we have to know the session timers configured (it vary between manufacturers). In Palo Alto, we can check as below:
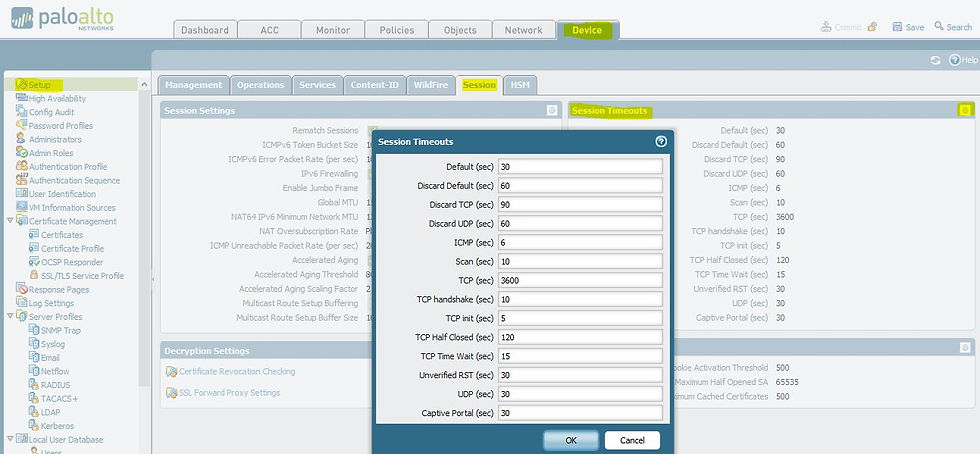
Discard TCP —Maximum length of time that a TCP session remains open after it is denied based on a security policy configured on the firewall. Default: 90. Range: 1-15,999,999.
TCP —Maximum length of time that a TCP session remains open without a response, after a TCP session is in the Established state (after the handshake is complete and/or data is being transmitted). Default: 3600. Range: 1-15,999,999.
TCP Handshake —Maximum length of time permitted between receiving the SYN-ACK and the subsequent ACK to fully establish the session. Default: 10. Range: 1-60.
TCP init —Maximum length of time permitted between receiving the SYN and SYN-ACK prior to starting the TCP handshake timer. Default: 5. Range: 1-60.
TCP Half Closed —Maximum length of time between receiving the first FIN and receiving the second FIN or a RST. Default: 120. Range: 1-604,800.
TCP Time Wait —Maximum length of time after receiving the second FIN or a RST. Default: 15. Range: 1-600.
Unverified RST —Maximum length of time after receiving a RST that cannot be verified (the RST is within the TCP window but has an unexpected sequence number, or the RST is from an asymmetric path). Default: 30. Range: 1-600.
Once we have clear the session timmers, we can check firewall sessions.
> show session info ==> to see the session count
In case we are working wit vsys, the command to check the session count will be
> show session meter
NOTE: compare number of active sessions vs number of sessions supported to discard Firewall is reaching its limits except on a PA-7000 Series firewall, the Current number of sessions can be greater than the Maximum configured for Sessions Limit because there are multiple dataplanes per virtual system.
In order to list the entire session list:
> show session all
NOTE: There is a limit in the number of sessions that can be shown with this command. The limit is based on the byte size of the session which cannot be changed.
The best practice in this case is to apply filters to list only the sessions we want to check, you can apply filters like user, source and destination ip-address, port, security rule, nat policy, application, zone, state, etc. it could be done as follow:
> show session all filter <tab> ==> to see all posible filters
> show session all filter source 1.2.3.4 destination 5.6.7.8 ==> source and destination example
> show session all filter application ftp state active ==> app example
In case you need to clear some session, you can do as below:
> clear session id <id_number>
EXAMPLE OUTPUTS:
admin@PA-3020> show session all filter source 192.168.116.140 destination 52.114.132.22
--------------------------------------------------------------------------------
ID Application State Type Flag Src[Sport]/Zone/Proto (translated IP[Port])
Vsys Dst[Dport]/Zone (translated IP[Port])
--------------------------------------------------------------------------------
83277 ssl ACTIVE FLOW NS 192.168.116.140[63823]/LAN/6 (213.9.159.129[61479])
vsys1 52.114.132.22[443]/INTERNET (52.114.132.22[443])
admin@PA-3020>
NOTE: about Flags:
NS ==>There has been Source NAT applied on the session.
ND ==> There has been Destination NAT applied on the session.
NB ==> There has been Both Source and Destination NAT applied on the session.
No flag ==> There is no NAT applied on the session.
If we know session id or once we know it (after command above) we can see that session in detail:
admin@PA-3020> show session id 83277
Session 83277
c2s flow:
source: 192.168.116.140 [LAN]
dst: 52.114.132.22
proto: 6
sport: 63823 dport: 443
state: ACTIVE type: FLOW
src user: it\rperez
dst user: unknown
s2c flow:
source: 52.114.132.22 [INTERNET]
dst: 213.9.159.129
proto: 6
sport: 443 dport: 61479
state: ACTIVE type: FLOW
src user: unknown
dst user: it\rperez
start time : Fri Aug 17 09:56:58 2018
timeout : 15 sec
time to live : 9 sec
total byte count(c2s) : 1879
total byte count(s2c) : 6494
layer7 packet count(c2s) : 10
layer7 packet count(s2c) : 11
vsys : vsys1
application : ssl
rule : LAN_to_INET_VIPs
session to be logged at end : True
session in session ager : True
session updated by HA peer : False
address/port translation : source
nat-rule : NAT_TO_INTERNET(vsys1)
layer7 processing : enabled
URL filtering enabled : True
URL category : computer-and-internet-info
session via syn-cookies : False
session terminated on host : False
session traverses tunnel : False
captive portal session : False
ingress interface : ethernet1/2
egress interface : ethernet1/1
session QoS rule : N/A (class 4)
tracker stage firewall : TCP RST - server
end-reason : tcp-rst-from-server
admin@PA-3020>
Session ID ==> id of the session.
c2s flow ==> Traffic Flow Client to Server (c2s)
s2c flow ==> Traffic Flow Server to Client (s2c).
source ==> source ip and zone.
dst ==> destination ip and zone.
Sport ==> source port.
Dport ==> destination port.
state ==>
There are seven states of a session working on a kind of loop, three of them are called stables and the other four are transient

NOTE: This is a Palo alto Clasification base don the explained TCP FSM (see FIREWALL SESSION. INTRO.) where INIT would be LISTEN, OPENING would be SYNC_SENT and SYN & SYN/ACK, ACTIVE would be ESTABLISHED, DISCARD/CLOSING would be CLOSE_WAIT and TIME_WAIT, CLOSED would be CLOSE and FREE would be NONE.
As the transient states are rarely seen, we are going to focus on stable ones:
INIT ==> Every session begins, by default, in INIT state. A session in the INIT state is part of the free pool and can be used at anytime. The session may been used previously, but has now been returned back into the free pool.
ACTIVE ==> Any session that matches a particular traffic flow, and has been processed for inspection and forwarding.
DISCARD ==> Traffic that has been matched by a session but is denied due to a security policy, etc.
type ==>
Palo Alto differs two session types;
Flow ==> Regular type of session where the flow is the same between c2s and s2c (ex. HTTP, SMTP, POP, SSH).
Predict ==> This type is applied to sessions that are created when Layer7 Application Layer Gateway (ALG) is required. The application has been identified and there is need for a new session to be allowed on the firewall without any additional security rule (ex. FTP active/passive, voice protocols h323/sip etc). These sessions may be created with a 0 as source/destination IP/port, since that information may not be known yet. Packets that match the Predict sessions will then change to normal FLOW session.
NOTE: You can view perdict session with “show session all filter type predict” command. This command might not show many predict sessions on the firewall due to the fact that each predict session will become a FLOW session once it is matched by a single packet. Therefore, the command will show only the predict sessions that are currently pending to be matched by packets. Each application's predict session has its own timeout setting.
src user ==> source user if User-ID is configured and working.
dst user ==> destination user if User-ID is configured and working.
Timeout ==> The specific timeout configured for the protocol.
time to live ==> The time left until the session will expire (Timeout countdown).
Traffic counts ==> Traffic counters.
application ==> Application identified.
rule ==> secure policy rule matching.
session to be logged at end ==> True if logged at the end, False if logged at the start.
session in session ager ==> True is time t olive not reach value 0.
address/port translation ==> True if NAT applied, False if NAT not applied.
nat-rule ==> NAT rule matching.
layer7 processing ==> Complete if application identified, enabled if application costantly identified.
URL filtering enabled ==> True or False.
URL category ==> result of URL categorization.
session traverses tunnel ==> True if match VPN tunnel.
Interfaces ==> In and Out interfaces.
session QoS rule ==> If traffic shaping applied.
tracker stage firewall ==>
This is the field that we can use to know if Traffic Flow is being offloaded on hardware or not.
If it appears “tracker stage firewall” it means that the Firewall is lower that PA3050 which does not have FPGA chip to offload a session.
If it appears “tracker stage l7proc” it means this is a PA3050 or upper model so it has FPGA chip to offload a session. Only if the value of this field is “ctd decoder bypass” we are facing an offloaded session.
NOTE: A post about HW acceleration is in my roadmap 😉
end-reason ==> The reason because the session has been closed, could be aged-out, policy-deny, tcp messages (fin, rst), threat, etc.
See you guys!!


Comentarios